Online customer service consultation
Email consultation
Leave a message to willyb@xm.com
Reply as soon as possible.
EURUSD
Euro vs U.S. Dollar
US500
S&P 500 (US500)
GOLD
Gold
COFFEE
US Coffee
Apple
Apple (AAPL.OQ)

Finance Magnates 颁发

Finance Magnates 颁发

Capital Finance International Magazine (CFI.co) 2024年颁赠

COLWMA 2024年颁赠

荣获World Finance Forex Awards 2023最佳外汇客户服务奖

荣获World Finance Forex Awards 2023欧洲最佳外汇经纪商奖

荣获World Finance Forex Awards 2023澳大拉西亚最佳外汇经纪商奖

荣获World Finance Forex Awards 2023拉丁美洲最佳外汇经纪商奖

荣获World Finance Forex Awards 2023中东最佳外汇经纪商奖

CFI.co于2023年颁赠

荣获2023年City of London Wealth Management Awards

荣获2022年埃及金融博览会颁赠

荣获2022年City of London Wealth Management Awards

CFI.co于2022年颁赠

荣获Global Forex Awards 2022 — 零售外汇 颁赠
2021年迪拜外汇博览会获颁赠

Ultimate Fintech 2021年颁赠

荣获2021年City of London Wealth Management Awards

FX168于2020年12月颁赠

荣获Global Business Awards 2020

荣获2020年City of London Wealth Management Awards

Capital Finance International Magazine (CFI.co)颁赠

Capital Finance International Magazine (CFI.co)颁赠

荣获2019年City of London Wealth Management Awards

Shares Magazine 授予 UK Forex Awards 2018

Capital Finance International Magazine (CFI.co)颁赠

Capital Finance International Magazine (CFI.co)颁赠

2017年伦敦财富管理奖

2016最佳本土 客户服务

中东和北非地区(MENA)增长最快的经纪商
2015年最佳外汇科技提供商
2014年最佳外汇科技提供商

2014年最佳外汇科技提供商

荣获 The Trading Show 2024年非洲 Africa Fintech 峰会颁赠

荣获2024年中东地区 Brokersview 颁赠
荣获2024年中东地区 Brokersview 颁赠

荣获2024年阿曼 Smart Vision 峰会颁赠

荣获2024年迪拜外汇博览会颁赠

荣获2024年迪拜 Forex Traders Summit 颁赠

2024年埃及 Smart Vision 峰会颁赠

投查查于2024年颁赠

Capital Finance International Magazine (CFI.co) 2024年颁赠

CFI.co于2023年颁赠

CFI.co于2023年颁赠

交易社区平台FOLLOWME于2022年颁赠
2022年迪拜Forex Expo获颁赠
2022年迪拜Forex Expo获颁赠

荣获Global Forex Awards 2022 — 零售外汇 颁赠

CFI.co于2022年颁赠

CFI.co于2022年颁赠

World Finance Forex Awards 2022 颁发

World Finance Forex Awards 2022 颁发

World Finance Forex Awards 2022 颁发

World Finance Forex Awards 2022 颁发
交易社区平台FOLLOWME于2021年颁赠

2021年埃及Smart Vision Investment Expo博览会获颁赠

CFI.co于2021年颁赠

CFI.co于2021年颁赠

荣获Global Forex Awards 2021 — 零售外汇 颁赠

荣获Global Forex Awards 2021 — 零售外汇 颁赠

World Finance 2021颁发

World Finance 2021颁发
FOLLOWME于2021年颁赠

Global Forex Awards 2021 — B2B 颁赠

Global Forex Awards颁赠

Global Forex Awards颁赠

CFI.co于2020年颁赠

CFI.co于2020年颁赠

荣获Global Business Awards 2020

World Finance Magazine 颁赠
World
Finance Forex Awards 2020

World Finance Magazine 颁赠
World
Finance Forex Awards 2020
FOLLOWME交易社区授予

Global Forex Awards颁赠

Global Forex Awards颁赠

FinTech Age Awards颁发

World Finance Magazine 颁赠
World
Finance Forex Awards 2019

World Finance Magazine 颁赠
World
Finance Forex Awards 2019

荣获 World Finance Forex Awards 2018 颁赠

荣获2018年埃及金融博览会颁赠

荣获 Shares Magazine 的 UK Forex Awards 2017 颁赠

荣获 World Finance Forex Awards 2017

2016年最佳黄金经纪商
2016年最佳外汇经纪商

2015年最佳本地客户服务

Global Brands Magazine 颁赠

Online Money Awards 2022 颁发

荣获2022年埃及金融博览会颁赠

2015最佳外汇交易平台

2015最佳金融交易平台

2013最佳创新外汇平台奖

2020年 Cyprus HR Awards 颁赠

金融行业的佼佼者

认证最优金牌级别

2014年首届亚军
Finance Magnates 颁发
Finance Magnates 颁发
Capital Finance International Magazine (CFI.co) 2024年颁赠
COLWMA 2024年颁赠
荣获World Finance Forex Awards 2023最佳外汇客户服务奖
荣获World Finance Forex Awards 2023欧洲最佳外汇经纪商奖
荣获World Finance Forex Awards 2023澳大拉西亚最佳外汇经纪商奖
荣获World Finance Forex Awards 2023拉丁美洲最佳外汇经纪商奖
荣获World Finance Forex Awards 2023中东最佳外汇经纪商奖
CFI.co于2023年颁赠
荣获2023年City of London Wealth Management Awards
荣获2022年埃及金融博览会颁赠
荣获2022年City of London Wealth Management Awards
CFI.co于2022年颁赠
荣获Global Forex Awards 2022 — 零售外汇 颁赠
2021年迪拜外汇博览会获颁赠
Ultimate Fintech 2021年颁赠
荣获2021年City of London Wealth Management Awards
FX168于2020年12月颁赠
荣获Global Business Awards 2020
荣获2020年City of London Wealth Management Awards
Capital Finance International Magazine (CFI.co)颁赠
Capital Finance International Magazine (CFI.co)颁赠
荣获2019年City of London Wealth Management Awards
Shares Magazine 授予 UK Forex Awards 2018
Capital Finance International Magazine (CFI.co)颁赠
Capital Finance International Magazine (CFI.co)颁赠
2017年伦敦财富管理奖
2016最佳本土 客户服务
中东和北非地区(MENA)增长最快的经纪商
2015年最佳外汇科技提供商
2014年最佳外汇科技提供商
2014年最佳外汇科技提供商
荣获 The Trading Show 2024年非洲 Africa Fintech 峰会颁赠
荣获2024年中东地区 Brokersview 颁赠
荣获2024年中东地区 Brokersview 颁赠
荣获2024年阿曼 Smart Vision 峰会颁赠
荣获2024年迪拜外汇博览会颁赠
荣获2024年迪拜 Forex Traders Summit 颁赠
2024年埃及 Smart Vision 峰会颁赠
投查查于2024年颁赠
Capital Finance International Magazine (CFI.co) 2024年颁赠
CFI.co于2023年颁赠
CFI.co于2023年颁赠
交易社区平台FOLLOWME于2022年颁赠
2022年迪拜Forex Expo获颁赠
2022年迪拜Forex Expo获颁赠
荣获Global Forex Awards 2022 — 零售外汇 颁赠
CFI.co于2022年颁赠
CFI.co于2022年颁赠
World Finance Forex Awards 2022 颁发
World Finance Forex Awards 2022 颁发
World Finance Forex Awards 2022 颁发
World Finance Forex Awards 2022 颁发
交易社区平台FOLLOWME于2021年颁赠
2021年埃及Smart Vision Investment Expo博览会获颁赠
CFI.co于2021年颁赠
CFI.co于2021年颁赠
荣获Global Forex Awards 2021 — 零售外汇 颁赠
荣获Global Forex Awards 2021 — 零售外汇 颁赠
World Finance 2021颁发
World Finance 2021颁发
FOLLOWME于2021年颁赠
Global Forex Awards 2021 — B2B 颁赠
Global Forex Awards颁赠
Global Forex Awards颁赠
CFI.co于2020年颁赠
CFI.co于2020年颁赠
荣获Global Business Awards 2020
World Finance Magazine 颁赠
World
Finance Forex Awards 2020
World Finance Magazine 颁赠
World
Finance Forex Awards 2020
FOLLOWME交易社区授予
Global Forex Awards颁赠
Global Forex Awards颁赠
FinTech Age Awards颁发
World Finance Magazine 颁赠
World
Finance Forex Awards 2019
World Finance Magazine 颁赠
World
Finance Forex Awards 2019
荣获 World Finance Forex Awards 2018 颁赠
荣获2018年埃及金融博览会颁赠
荣获 Shares Magazine 的 UK Forex Awards 2017 颁赠
荣获 World Finance Forex Awards 2017
2016年最佳黄金经纪商
2016年最佳外汇经纪商
2015年最佳本地客户服务
Global Brands Magazine 颁赠
Online Money Awards 2022 颁发
荣获2022年埃及金融博览会颁赠
2015最佳外汇交易平台
2015最佳金融交易平台
2013最佳创新外汇平台奖
2020年 Cyprus HR Awards 颁赠
金融行业的佼佼者
认证最优金牌级别
2014年首届亚军

Awarded BestBrokerYear After Year
Wonderful introduction:
Hello everyone, today XM Forex will bring you "Trading Recommendations and Trade Analysis for GBP/USD on April 30. Will the Flat End for the Pound?" Hope this helps you! The original content is as follows:
Today, only the euro was traded using the Mean Reversion strategy. I did not take any trades using M
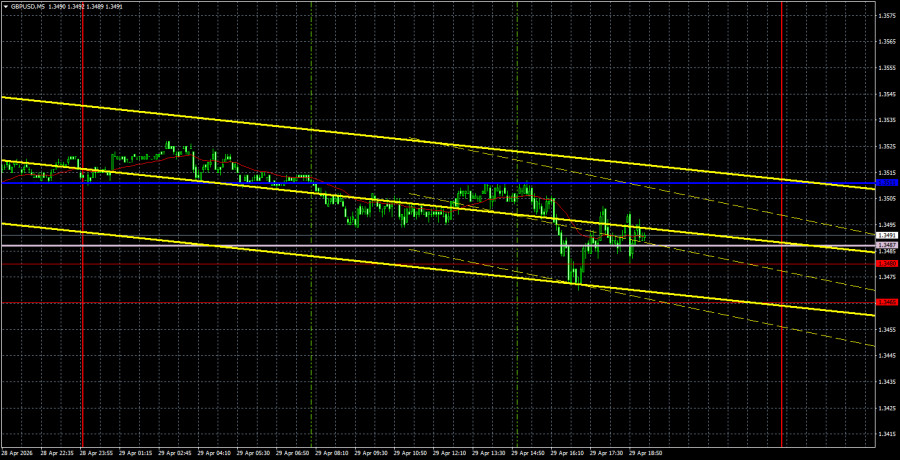
The xm外汇中文客服GBP/USD currency pair once again attempted to surpass the support area of 1.3465-1.3480 on Wednesday, but failed once again. Therefore, the sideways channel of 1.3465-1.3588 remains relevant. We would only consider a downward trend below the 1.3465-1.3480 area. Volatility was again minimal on Wednesday, ahead of the late evening FOMC meeting. We are not currently considering the meeting's results or the market's reaction to them. However, it is worth noting that traders once again ignored the relatively important durable goods orders report in the U.S.
On the hourly timeframe, as we mentioned, the upward trend remains intact. There is no trend line at present, but there is no need for one right now. The first half of the week has been entirely devoid of fundamental and macroeconomic events, and only the FOMC meeting last night stirred the market slightly. Today, the Bank of England will take over this baton, so volatility throughout the day may be heightened. However, by the end of Thursday, the GBP/USD pair may still remain above the solid support area of 1.3465-1.3480.
On the 5-minute timeframe, several trading signals formed on Wednesday, but there was no reason to execute them. Initially, the pair consolidated below the critical line, then rebounded from the area of 1.3465-1.3480. The first signal was not worth paying attention to, as a powerful support area lay just below. The second signal could have been executed by traders, but we did not see any movement upwards again. It should be noted that in a flat, the lines of the Ichimoku indicator lose strength, so the boundaries of the sideways channel serve as the main points of reference.
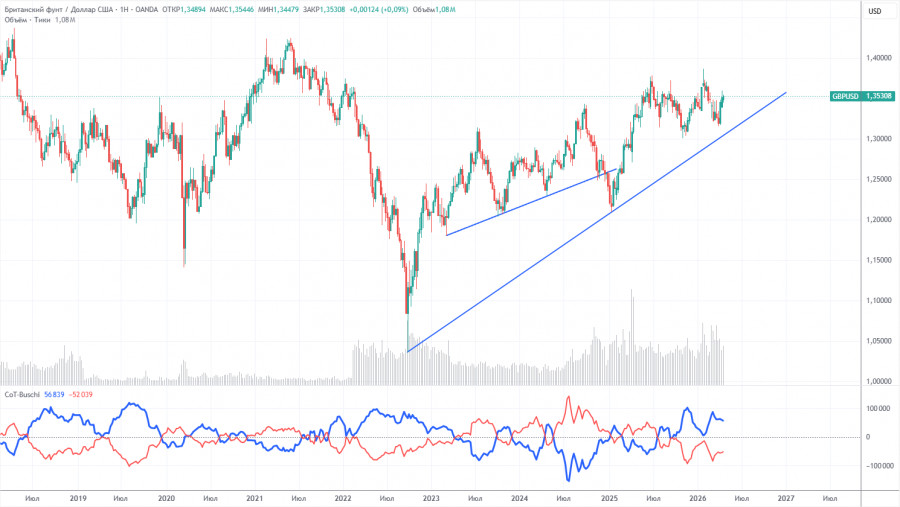
The COT reports for the British pound show that commercial traders' sentiment has been changing steadily over the past few years. The red and blue lines, which reflect the net positions of commercial and non-commercial traders, frequently cross and are often near the zero mark. Currently, the lines are moving apart, with non-commercial traders predominating with... sales. However, given events in the Middle East, it is not surprising that demand for risk currencies is falling while demand for the dollar is rising.
In the long term, the dollar continues to decline due to Donald Trump's policies, as seen on the weekly timeframe (illustration above). The trade war will continue in one form or another for a long time, and Trump's policies are aimed directly and indirectly at weakening the U.S. currency. However, geopolitical factors are currently the priority and have recently provided strong support for the dollar. Given the ongoing conflict in the Middle East, the U.S. dollar may still have growth potential. According to the latest COT report (dated April 21), the "Non-commercial" group opened 8,100 BUY contracts and 5,500 SELL contracts. Consequently, the net position of non-commercial traders increased by 2,600 contracts over the week.
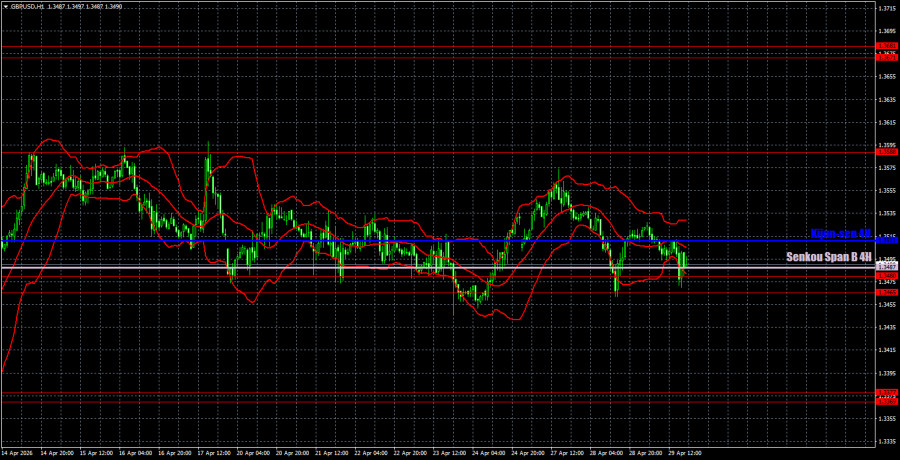
On the hourly timeframe, the GBP/USD pair continues to form an upward trend, which could be reversed if the British pound consolidates below the 1.3465-1.3480 area. The influence of geopolitical factors is weakening, as indicated by recent movements; however, military actions in the region are currently on hold. The Strait of Hormuz remains blocked, and there has been no progress in negotiations, yet there are indications that discussions are still occurring at a distance. This situation supports an upward bias in the British pound.
For April 30, we highlight the following important levels: 1.3096-1.3115, 1.3179-1.3187, 1.3369-1.3377, 1.3465-1.3480, 1.3588, 1.3671-1.3681, 1.3751-1.3763. The Senkou Span B line (1.3487) and Kijun-sen line (1.3511) may also provide signals. It is recommended to set a stop-loss order to break even if the price moves in the correct direction by 20 pips. The Ichimoku indicator lines may shift throughout the day, which should be taken into account when determining trading signals.
On Thursday, the Bank of England meeting is scheduled, and the U.S. will release its first-quarter GDP report in an initial estimate. Additionally, the market may continue to factor in the FOMC meeting results and Jerome Powell's speech. Thus, today, heightened volatility can be expected, but the pound's key task right now is to break out of the sideways channel.
Today, traders may consider short positions targeting 1.3369-1.3377 if the price consolidates below the 1.3465-1.3480 range. Long positions remain relevant, with a target of 1.3588, as the price has bounced from the 1.3465-1.3480 area.
Price levels of support and resistance – thick red lines, around which the movement may end. They are not sources of trading signals.
Kijun-sen and Senkou Span B lines – lines of the Ichimoku indicator that are carried over to the hourly timeframe from the 4-hour one. They are strong lines.
Extreme levels – thin red lines from which the price has previously bounced. They are sources of trading signals.
Yellow lines – trend lines, trend channels, and any other technical patterns.
Indicator 1 on COT charts – the size of the net position of each category of traders.
So, after a powerful short initiative during the American session, the instrumen
The above content is all about "Trading Recommendations and Trade Analysis for GBP/USD on April 30. Will the Flat End for the Pound?" It was carefully xm-links.compiled and edited by the editor of XM Foreign Exchange. I hope it will be helpful to your trading! Thanks for the support!
Disclaimers: XM Group only provides execution services and access permissions for online trading platforms, and allows individuals to view and/or use the website or the content provided on the website, but has no intention of making any changes or extensions, nor will it change or extend its services and access permissions. All access and usage permissions will be subject to the following terms and conditions: (i) Terms and conditions; (ii) Risk warning; And (iii) a complete disclaimer. Please note that all information provided on the website is for general informational purposes only. In addition, the content of all XM online trading platforms does not constitute, and cannot be used for any unauthorized financial market trading invitations and/or invitations. Financial market transactions pose significant risks to your investment capital.
All materials published on online trading platforms are only intended for educational/informational purposes and do not include or should be considered for financial, investment tax, or trading related consulting and advice, or transaction price records, or any financial product or non invitation related trading offers or invitations.
All content provided by XM and third-party suppliers on this website, including opinions, news, research, analysis, prices, other information, and third-party website links, remains unchanged and is provided as general market commentary rather than investment advice. All materials published on online trading platforms are only for educational/informational purposes and do not include or should be considered as applicable to financial, investment tax, or trading related advice and recommendations, or transaction price records, or any financial product or non invitation related financial offers or invitations. Please ensure that you have read and fully understood the information on XM's non independent investment research tips and risk warnings. For more details, please click here


